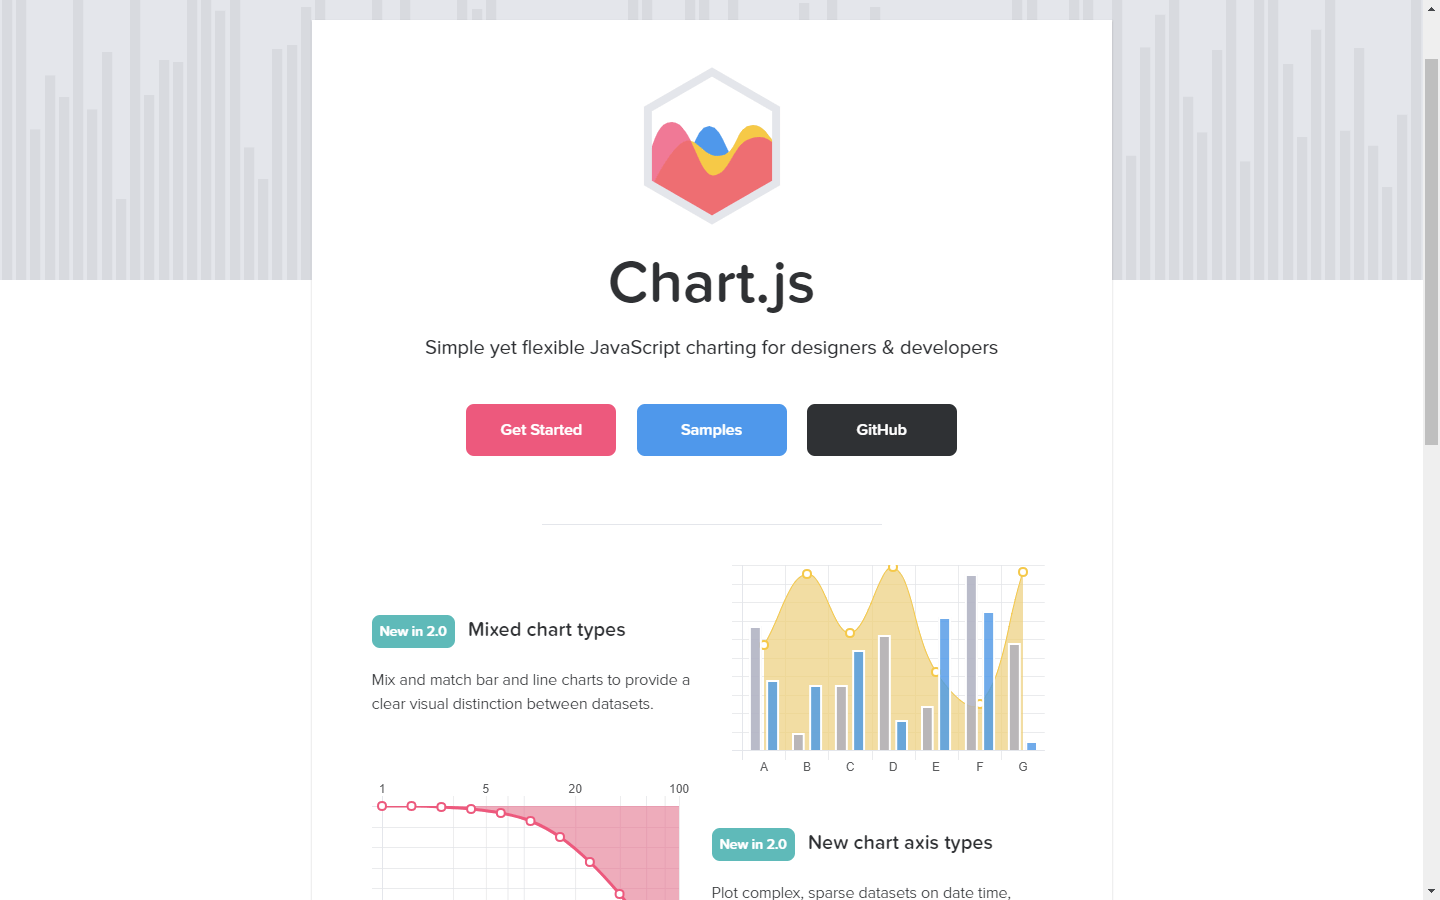
En este post voy a compartir como generar gráficas de barras con PHP y MySQL usando Chart.js, he querido usar este ejemplo ya que uso este tipo de gráficas en uno de mis sistemas web de pago: Sistema de Control de Inventario y Facturación y he pensado que podría ser útil compartir esta información, sobre como generar dichos gráficos.
Empezando
He usado el CDN de Bootstrap y jQuery en este tutorial, así que necesitas conexión a Internet para que funcionen. La librería Chart.js que he utilizado en este tutorial se incluye en el archivo descargable de este tutorial.
Creando nuestra base de datos
Primero, vamos a crear nuestra base de datos.
1. Abre phpMyAdmin. 2. Haz clic en bases de datos, cree una base de datos y asígnele el nombre como test_chartjs (asi la he nombrado para este ejemplo). 3. Después de crear una base de datos, haz clic en el SQL y pega el código a continuación.
-- phpMyAdmin SQL Dump -- version 4.5.1 -- http://www.phpmyadmin.net -- -- Servidor: 127.0.0.1 -- Tiempo de generación: 17-01-2018 a las 23:50:58 -- Versión del servidor: 10.1.19-MariaDB -- Versión de PHP: 7.0.13SET SQL_MODE = "NO_AUTO_VALUE_ON_ZERO"; SET time_zone = "+00:00";
/*!40101 SET @OLD_CHARACTER_SET_CLIENT=@@CHARACTER_SET_CLIENT */; /*!40101 SET @OLD_CHARACTER_SET_RESULTS=@@CHARACTER_SET_RESULTS */; /*!40101 SET @OLD_COLLATION_CONNECTION=@@COLLATION_CONNECTION */; /*!40101 SET NAMES utf8mb4 */;
-- -- Base de datos: `test_chartjs` --
-- --------------------------------------------------------
-- -- Estructura de tabla para la tabla `purchases` --
CREATE TABLE `purchases` ( `purchasesid` int(11) NOT NULL, `amount` double NOT NULL, `purchase_date` date NOT NULL ) ENGINE=InnoDB DEFAULT CHARSET=latin1;
-- -- Volcado de datos para la tabla `purchases` --
INSERT INTO `purchases` (`purchasesid`, `amount`, `purchase_date`) VALUES (1, 50, '2018-01-17'), (2, 60, '2018-02-09');
-- --------------------------------------------------------
-- -- Estructura de tabla para la tabla `sales` --
CREATE TABLE `sales` ( `salesid` int(11) NOT NULL, `amount` double NOT NULL, `sales_date` date NOT NULL ) ENGINE=InnoDB DEFAULT CHARSET=latin1;
-- -- Volcado de datos para la tabla `sales` --
INSERT INTO `sales` (`salesid`, `amount`, `sales_date`) VALUES (1, 25, '2018-01-17'), (2, 35, '2018-02-02');
-- -- Índices para tablas volcadas --
-- -- Indices de la tabla `purchases` -- ALTER TABLE `purchases` ADD PRIMARY KEY (`purchasesid`);
-- -- Indices de la tabla `sales` -- ALTER TABLE `sales` ADD PRIMARY KEY (`salesid`);
-- -- AUTO_INCREMENT de las tablas volcadas --
-- -- AUTO_INCREMENT de la tabla `purchases` -- ALTER TABLE `purchases` MODIFY `purchasesid` int(11) NOT NULL AUTO_INCREMENT, AUTO_INCREMENT=3; -- -- AUTO_INCREMENT de la tabla `sales` -- ALTER TABLE `sales` MODIFY `salesid` int(11) NOT NULL AUTO_INCREMENT, AUTO_INCREMENT=3; /*!40101 SET CHARACTER_SET_CLIENT=@OLD_CHARACTER_SET_CLIENT */; /*!40101 SET CHARACTER_SET_RESULTS=@OLD_CHARACTER_SET_RESULTS */; /*!40101 SET COLLATION_CONNECTION=@OLD_COLLATION_CONNECTION */;
Creando conexión a la base de datos
Ahora vamos a crear la conexión a la base de datos, para ello creamos un archivo llamado "conexion.php" y pegamos el código siguiente:
<?php $db_host="localhost";//Nombre del host $db_user="root";//Usuario de la base de datos $db_pass="";//Contraseña de usuario de base de datos $db_name="test_chartjs";//Nombre de la base de datos $conn = new mysqli($db_host, $db_user, $db_pass, $db_name);if ($conn->connect_error) { die("Conexión falló: " . $conn->connect_error); } ?>
index.php
Este es nuestro archivo de inicio que contiene nuestro formulario de adición simple de datos y nuestra representación estadística de datos extraídos de la base de datos. Esto también contiene nuestro script de que genera la gráfica de barras.
<!DOCTYPE html> <html> <head> <title>Generar gráficas de barras con PHP usando Chart.js</title> <link rel="stylesheet" href="https://maxcdn.bootstrapcdn.com/bootstrap/3.3.7/css/bootstrap.min.css" /> <script src="https://ajax.googleapis.com/ajax/libs/jquery/3.1.0/jquery.min.js"></script> <script src="https://maxcdn.bootstrapcdn.com/bootstrap/3.3.7/js/bootstrap.min.js"></script><!-- ChartJS --> <script src="chart.js/Chart.js"></script> </head> <body> <div class="container-fluid"> <h1 class="page-header text-center">Reporte de datos usando Chart.js</h1> <div class="row"> <div class="col-md-3"> <h3 class="page-header text-center">Añadir compra/venta</h3> <form method="POST" action="add_data.php"> <div class="form-group"> <label>Monto:</label> <input type="text" class="form-control" name="amount" required> </div> <div class="form-group"> <label>Fecha:</label> <input type="date" class="form-control" name="sales_date" required> </div>
<div class="form-group"> <label>Tipo de transacción:</label> <select name="type" id="type" class='form-control' required> <option value="">--Selecciona--</option> <option value="1">Ventas</option> <option value="2">Compras</option> </select> </div> <button type="submit" class="btn btn-primary"><span class="glyphicon glyphicon-floppy-disk"></span> Guardar</button> </form> </div> <div class="col-md-9"> <div class="box box-success"> <div class="box-header with-border"> <?php //set timezone date_default_timezone_set('America/El_Salvador'); $year = date('Y'); ?> <h3 class="box-title">Reporte de compras & Ventas <?php echo $year; ?></h3>
</div> <div class="box-body"> <div class="chart"> <canvas id="barChart" style="height:230px"></canvas> </div> </div> <!-- /.box-body --> </div> </div> </div> </div> <?php include('data.php'); ?> <script> $(function () { var barChartData = { labels : ['Enero', 'Febrero', 'Marzo', 'Abril', 'Mayo', 'Junio', 'Julio', 'Agosto', 'Septiembre', 'Octubre', 'Noviembre', 'Diciembre'], datasets: [ { label : 'Compras', fillColor : 'rgba(210, 214, 222, 1)', strokeColor : 'rgba(210, 214, 222, 1)', pointColor : 'rgba(210, 214, 222, 1)', pointStrokeColor : '#c1c7d1', pointHighlightFill : '#fff', pointHighlightStroke: 'rgba(220,220,220,1)', data : [ "<?php echo $pjan; ?>", "<?php echo $pfeb; ?>", "<?php echo $pmar; ?>", "<?php echo $papr; ?>", "<?php echo $pmay; ?>", "<?php echo $pjun; ?>", "<?php echo $pjul; ?>", "<?php echo $paug; ?>", "<?php echo $psep; ?>", "<?php echo $poct; ?>", "<?php echo $pnov; ?>", "<?php echo $pdec; ?>" ] }, { label : 'Ventas', fillColor : 'rgba(60,141,188,0.9)', strokeColor : 'rgba(60,141,188,0.8)', pointColor : '#3b8bba', pointStrokeColor : 'rgba(60,141,188,1)', pointHighlightFill : '#fff', pointHighlightStroke: 'rgba(60,141,188,1)', data : [ "<?php echo $tjan; ?>", "<?php echo $tfeb; ?>", "<?php echo $tmar; ?>", "<?php echo $tapr; ?>", "<?php echo $tmay; ?>", "<?php echo $tjun; ?>", "<?php echo $tjul; ?>", "<?php echo $taug; ?>", "<?php echo $tsep; ?>", "<?php echo $toct; ?>", "<?php echo $tnov; ?>", "<?php echo $tdec; ?>" ] } ] } var barChartCanvas = $('#barChart').get(0).getContext('2d') var barChart = new Chart(barChartCanvas) var barChartData = barChartData barChartData.datasets[1].fillColor = '#00a65a' barChartData.datasets[1].strokeColor = '#00a65a' barChartData.datasets[1].pointColor = '#00a65a' var barChartOptions = { //Boolean - Whether the scale should start at zero, or an order of magnitude down from the lowest value scaleBeginAtZero : true, //Boolean - Whether grid lines are shown across the chart scaleShowGridLines : true, //String - Colour of the grid lines scaleGridLineColor : 'rgba(0,0,0,.05)', //Number - Width of the grid lines scaleGridLineWidth : 1, //Boolean - Whether to show horizontal lines (except X axis) scaleShowHorizontalLines: true, //Boolean - Whether to show vertical lines (except Y axis) scaleShowVerticalLines : true, //Boolean - If there is a stroke on each bar barShowStroke : true, //Number - Pixel width of the bar stroke barStrokeWidth : 2, //Number - Spacing between each of the X value sets barValueSpacing : 5, //Number - Spacing between data sets within X values barDatasetSpacing : 5, //String - A legend template legendTemplate : '<ul class="<%=name.toLowerCase()%>-legend"><% for (var i=0; i<datasets.length; i++){%><li><span style="background-color:<%=datasets[i].fillColor%>"></span><%if(datasets[i].label){%><%=datasets[i].label%><%}%></li><%}%></ul>', //Boolean - whether to make the chart responsive responsive : true, maintainAspectRatio : true }
barChartOptions.datasetFill = false barChart.Bar(barChartData, barChartOptions)
}) </script> </body> </html>
add_data.php
Este es nuestro código PHP que permite agregar registros a nuestra base de datos.
<?php
	include("conexion.php");//Me conecto a la base de datos
	$amount=floatval($_POST['amount']);
	$date=$_POST['sales_date'];
	$type=intval($_POST['type']);
	if ($type==1){
		$sql="insert into sales (amount, sales_date) values ('$amount', '$date')";
	} else if ($type==2){
		$sql="insert into purchases (amount, purchase_date) values ('$amount', '$date')";
	}
	$conn->query($sql);
	header('location:index.php');
?>
data.php
Por último, vamos a crear nuestro código PHP que contiene los datos que se van a utilizar para generar la gráfica de barras con PHP y MySQL usando chart.js
<?php
	include("conexion.php");//Me conecto a la base de datos
	//set timezone
	date_default_timezone_set('America/El_Salvador');
	$year = date('Y');
	$total=array();
	for ($month = 1; $month <= 12; $month ++){
		$sql="select *, sum(amount) as total from sales where month(sales_date)='$month' and year(sales_date)='$year'";
		$query=$conn->query($sql);
		$row=$query->fetch_array();
		$total[]=$row['total'];
	}
	$tjan = $total[0];
	$tfeb = $total[1];
	$tmar = $total[2];
	$tapr = $total[3];
	$tmay = $total[4];
	$tjun = $total[5];
	$tjul = $total[6];
	$taug = $total[7];
	$tsep = $total[8];
	$toct = $total[9];
	$tnov = $total[10];
	$tdec = $total[11];
	$pyear = $year - 1;
	$pnum=array();
	for ($pmonth = 1; $pmonth <= 12; $pmonth ++){
		$sql="select *, sum(amount) as ptotal from purchases where month(purchase_date)='$pmonth' and year(purchase_date)='$year'";
		$pquery=$conn->query($sql);
		$prow=$pquery->fetch_array();
		$ptotal[]=$prow['ptotal'];
	}
	$pjan = $ptotal[0];
	$pfeb = $ptotal[1];
	$pmar = $ptotal[2];
	$papr = $ptotal[3];
	$pmay = $ptotal[4];
	$pjun = $ptotal[5];
	$pjul = $ptotal[6];
	$paug = $ptotal[7];
	$psep = $ptotal[8];
	$poct = $ptotal[9];
	$pnov = $ptotal[10];
	$pdec = $ptotal[11];
?>
Y aquí termina este tutorial. Te invito a que descargues los archivos fuentes usados para este ejemplo y realices las pruebas que consideres necesarias.


Comentarios